Real Estate Trends Then and Now: 80s Edition


Disclaimer: The information provided on this site does not, and is not intended to, constitute legal, financial, tax, or real estate advice. Please consult your expert for advice in those areas. All content is for general informational purposes only and is not intended to provide a complete description of the subject matter. Although Blueprint provides information it believes to be accurate, Blueprint makes no representations or warranties about the accuracy or completeness of the information contained on this site. Specific processes will vary based on applicable law. The title and closing process will be handled by a third-party attorney to the extent required by law. Product offerings vary by jurisdiction and are not available or solicited in any state where we are not licensed.
Nostalgia often comes with a pair of rose-tinted glasses. The 80s is a well-loved decade for its colorful spandex, hair metal bands, and music videos. Despite the fondness for the decade many of us have now, it was a tumultuous time for the economy as new monetary policies were introduced to tamp down runaway inflation at the onset of the decade.
Rising interest rates hit the housing market particularly hard, but it wasn’t all bad. The home price to median household income ratio was 4.86 at its height in the 80s compared to 7.76 as of June 30, 2022.
Here’s a look at a few housing market numbers from the 80s compared to today.

The 80s may be known for big hair, excessive wealth, and the rise of the “Yuppie,” but homes were more modest back then.
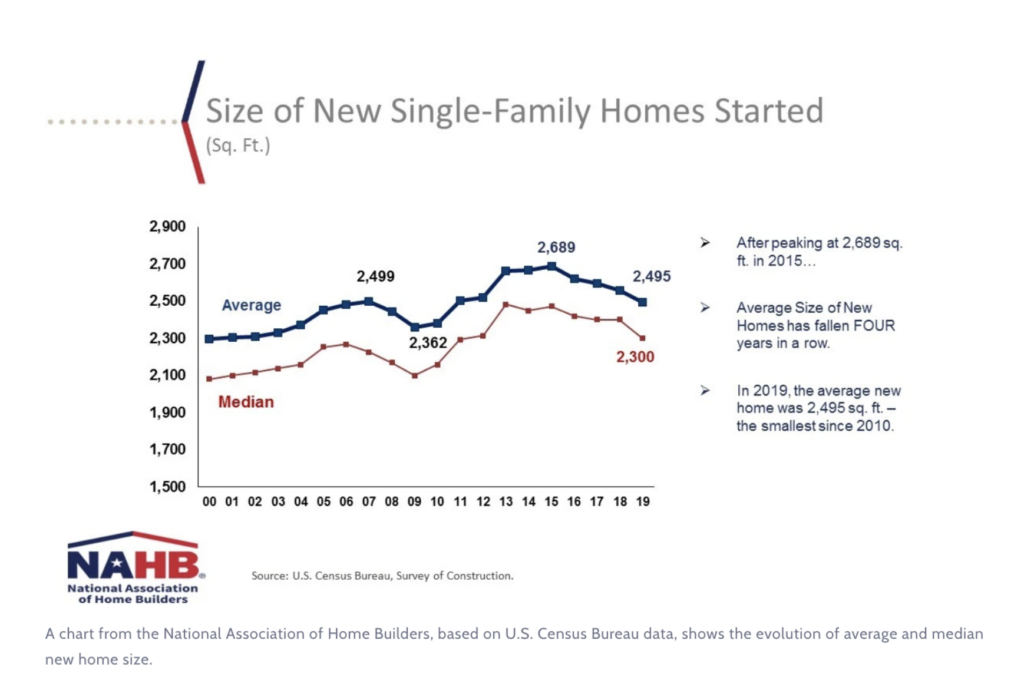
In 1981, buyers purchased single-family detached homes that averaged 1,700 square feet to share with a family of 3.27. Even though the size of the average U.S. family is shrinking, our homes are getting much bigger. Today, families averaging 3.13 people have more space to spread out, as the median square footage totals 2,356.
According to Marketplace.org, house sizes peaked in 2015 at a whopping 2,689 square feet but have gradually decreased as more Millennials bought their first homes.
Homes aren’t just larger today; they also cost more. According to one ATTOM Report, the average home sold for $301,000 in 2021. Meanwhile, CNBC reported that the average home sold for $47,200 in 1980.
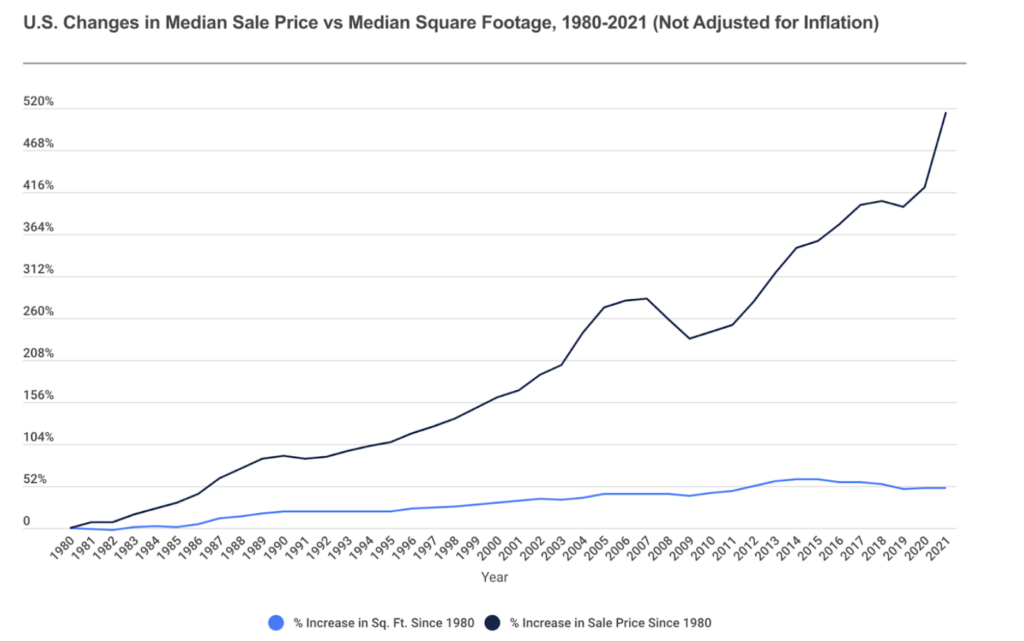
An analysis of this jump from Home Bay, a California-based real estate company, shows the median price per square foot for a single-family house has risen 310% since 1980. When adjusted for inflation, that’s an increase of 24.6%.
Unsurprising to those who have bought property recently, the biggest leaps in housing prices have been since 2020. In the same analysis from Home Bay, the authors point out that adjusting for inflation, the price per square foot of a new single-family home has increased 11% in only two years.
If buying property today, you can expect to pay an average of $169 per square foot, but the number can vary wildly depending on the market.
A survey of the most-populous U.S. metro areas shows that buyers in San Jose, CA, can often expect to fork over the most at $801 per square foot. Meanwhile, those shopping in Memphis, TN, will typically find the best deals at an average of $92 per square foot.
A slowdown in demand and lower list prices doesn’t necessarily translate to more affordable mortgage payments. Compared to the previous month, one report from the National Association of Realtors shows that existing home sales prices fell by an average of $10,000 in July 2022. In contrast to last year, existing-home sales prices increased by 10.8%. Even though prices are falling, price appreciation growth is still rising.
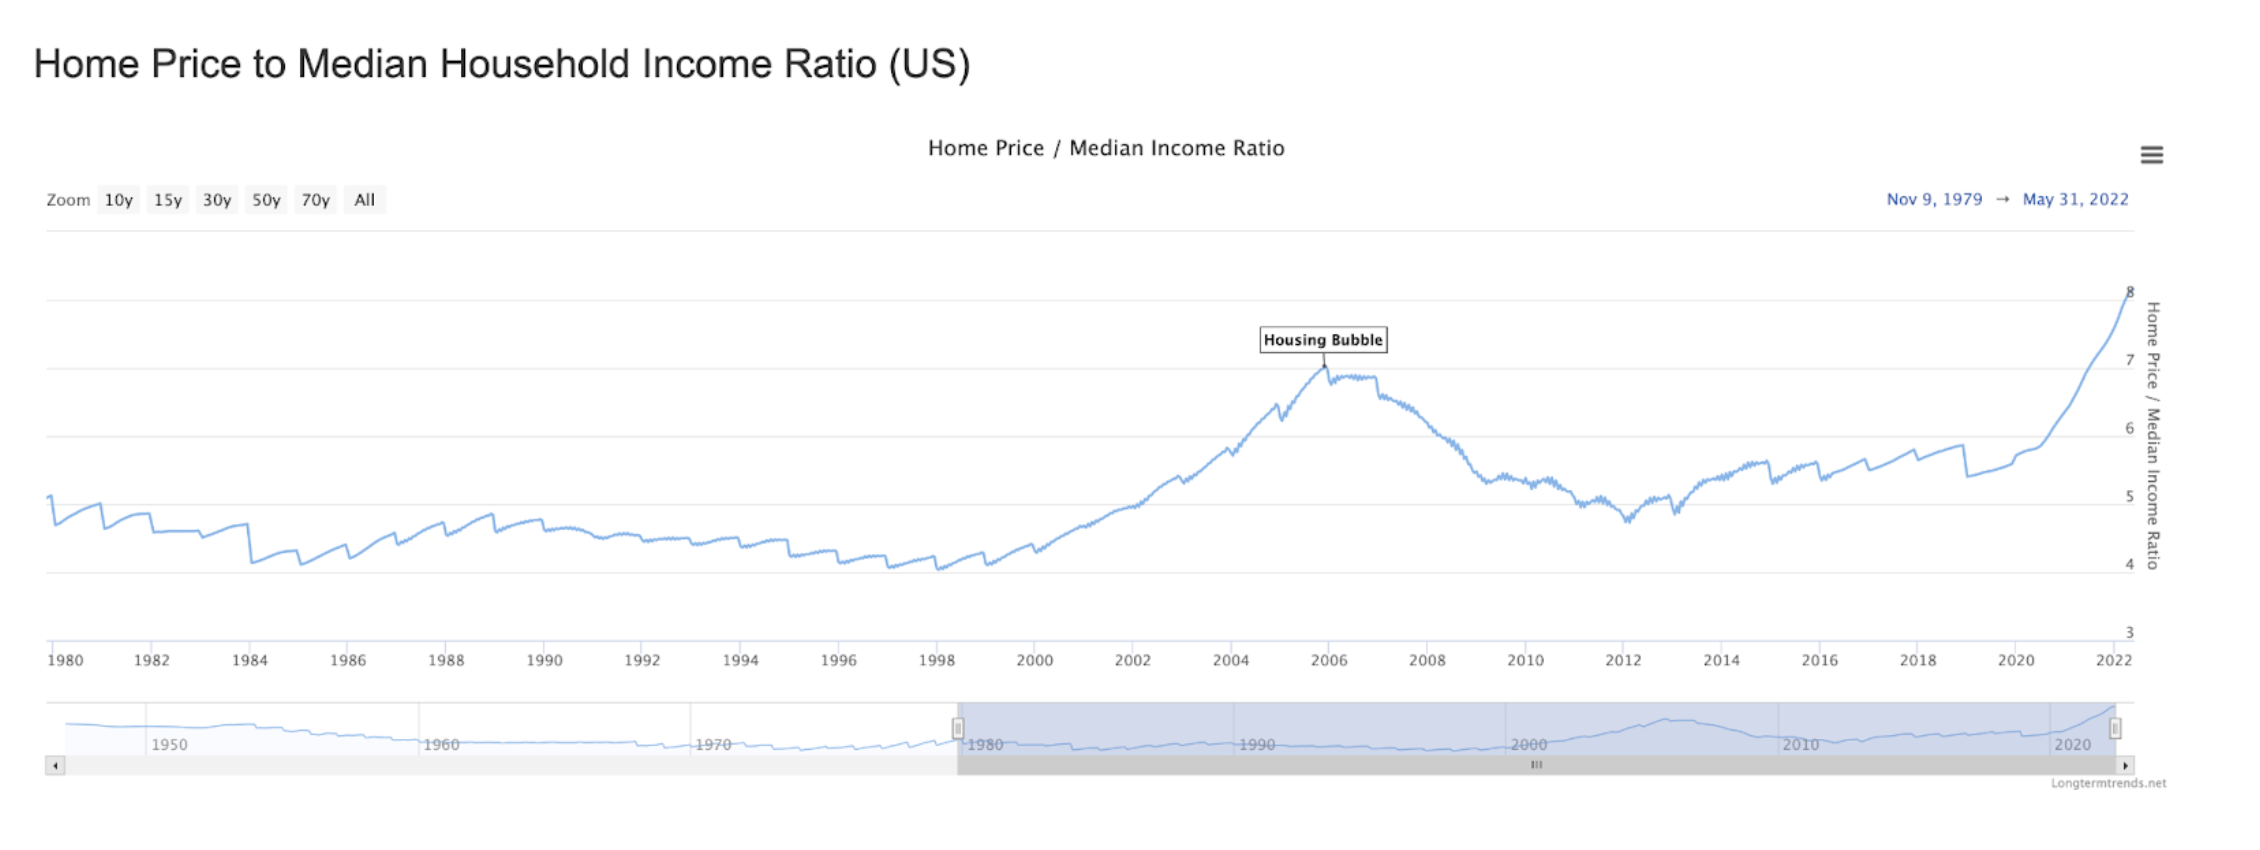
Month-to-month price changes don’t capture the whole story, so another way to understand housing affordability is to compare home prices to the median income year to year. This ratio gives a clearer picture of U.S. households’ growth and decline in purchasing power. The higher the ratio, the less affordable homes are.
In January of 1980, the ratio was 4.69. The lowest for the decade was 4.11 in January 1985, and the highest was 4.86 in November 1988.
As of June 2022, the ratio stands at 7.76, a marginal slip from the highest ratio on record, which occurred in May of the same year. The chart below from longtermtrends.com shows the sharp increase from 2020 to today.
During the pandemic, seasonally-adjusted purchase-only price appreciation rose almost 20%.
Almost everything, including homebuying, has become more expensive due to 40-year high inflation. The Federal Reserve is doing its best to stop inflation by incrementally raising interest rates.
While there is concern that inflation and higher rates will cause another housing market crash, there’s little evidence to support it. According to the Urban Institute, the correlation between changes in mortgage rates and price appreciation growth rate is weak but positive.
Additionally, the Urban Institute points out in the same article that when mortgage rates increase, there is a nominal increase in home price appreciation. The 45-year-average for price appreciation growth hovers at 5.1%. So while price appreciation is expected to slow and even reverse compared to the previous two years, the overall growth rate is not likely to dip below the long-term average.
The lack of housing supply provides additional protection from loss of equity. That’s good news for current homeowners and real estate investors, but, as the Urban Institutes concludes, for the average homebuyer, this means that affordability issues will continue despite the price declines.
Month-to-month price changes don’t capture the whole story, so another way to understand housing affordability is to compare home prices to the median income year to year. This ratio gives a clearer picture of U.S. households’ growth and decline in purchasing power. The higher the ratio, the less affordable homes are.
In January of 1980, the ratio was 4.69. The lowest for the decade was 4.11 in January 1985, and the highest was 4.86 in November 1988.
As of June 2022, the ratio stands at 7.76, a marginal slip from the highest ratio on record, which occurred in May of the same year. The chart below from longtermtrends.com shows the sharp increase from 2020 to today.
Compared to 2020, which saw the lowest mortgage rates in history at 2.68%, the average for the 30-year fixed is nearing 7% in 2022.
Bankrate data shows national mortgage rates rose for all loan terms in early September 2022. The rise in rates adds hundreds of dollars to monthly mortgage payments. Despite the cooling off of list prices in several markets, the change has pushed many buyers out as affordability is further reduced.
Mortgage rates reached their all-time highest in 1981, with an annual average of 16.63%, according to Freddie Mac data.
How did rates get so high in the 80s?
In the early 1980s, Federal Reserve Chairman Paul Volcker was among the most-criticized political figures of the time because of his aggressive monetary policies aimed at taming inflation. His approach focused on limiting growth in money and credit, so industries that relied on borrowing, like manufacturing and construction, were forced to lay off workers.
While long-term fixed mortgage rates track more closely with the 10-year treasury bond rate, hikes in short-term rates typically have a negative impact on the construction industry’s access to credit. A lack of access to loans in the construction industry created a ripple effect, dampening homebuilder confidence, slowing down housing starts, and reducing the housing supply.
Additionally, the ten-year treasury bond rate increased from 11% to more than 15% in 1981, pushing mortgage interest rates to their highest in recorded history.
Rising interest rates may help cool demand and slow the rate of home value appreciation, but they don’t address supply-side issues. Historically, higher mortgage rates have made the problem of housing shortages worse.
Homebuilders told Business Insider that higher mortgage rates lead to lower sales and spikes in cancellations. On the bright side, one builder mentioned the slowdown in demand might help relieve the supply chain disruptions and labor shortages in construction experienced since the onset of the pandemic.
According to federalreservehistory.com, in 1981, many believed Volcker would change course as unemployment rose and long-term interest rates continued to rise.
With unemployment in construction at 22%, Volcker was the focus of more public protests than any other Fed Chairman. One form of protest involved contractors and carpenters mailing in their lumber and other supplies to Volcker’s office because they claimed it was no longer needed since no one was buying houses.
Despite the protests, Volcker stayed the course, and ultimately, his steadfastness is credited with preventing the double-digit inflation of the 1970s. However, the cost was high. The nation experienced not one but two recessions right after each other, unemployment soared, and home building plummeted.
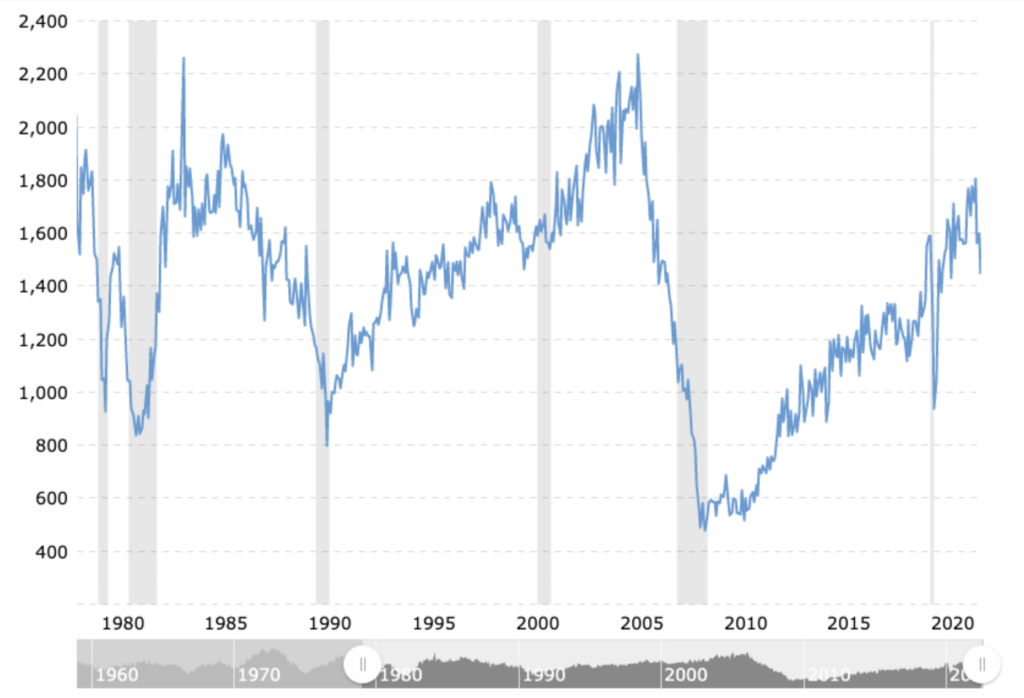
Looking at the numbers from macrotrends.net, in the 1980s, the worst slump came in November 1981 with only 837 housing starts, while the peak reached 2,260 in February 1984.
In July of 2022, total housing starts stood at 1,446. The worst decline, however, occurred from 2006 to 2009.
While there’s been a steady increase since then, research from Realtor.com estimates the gap between household formations and single-family construction grew to 5.24 million as of June 2021, exacerbating the shortage of single-family homes.
Today, the Federal Reserve is taking strong measures to combat inflation. Like Volcker, Fed Chairman Jerome H. Powell has focused on controlling prices by imposing rate hikes. Reports show that the Consumer Price Index (CPI) is still rising, but the all-items index is slightly down from 8.3% in August to 8.2% in September.
The numbers are constantly changing, and many economic factors can impact the housing market. The pandemic and the U.S. government’s responses to it created unprecedented additional factors still being borne out. Whether you’re buying now or waiting and watching, investing in real estate is usually seen as a good hedge against inflation, as noted by Ari Rastegar, CEO of Restegar Property Company, in this Forbes article.
While the housing market may be unpredictable, your closing shouldn’t be. Working with a title and closing platform like Blueprint allows you to submit and track your transactions in one centralized dashboard or sync your data in your preferred software using our API. Our closing processes are also designed to accommodate more complex, non-traditional transactions like novations, assignment contracts, and double closings commonly used by investors.
Learn more about Blueprint by requesting a demo here.
The information provided on this site does not, and is not intended to, constitute legal, financial, tax, or real estate advice. Please consult your expert for advice in those areas. All content is for general informational purposes only and is not intended to provide a complete description of the subject matter. Although Blueprint provides information it believes to be accurate, Blueprint makes no representations or warranties about the accuracy or completeness of the information contained on this site. Specific processes will vary based on applicable law. The title and closing process will be handled by a third-party attorney to the extent required by law. Product offerings vary by jurisdiction and are not available or solicited in any state where we are not licensed.